Description
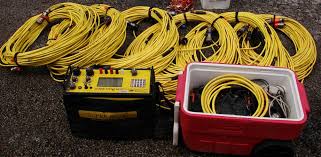
High-speed 2D/3D Resistivity/IP/SP Imaging System Package – 56 Electrodes
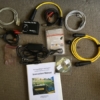
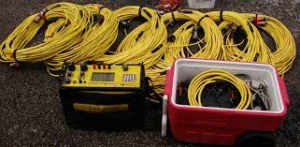
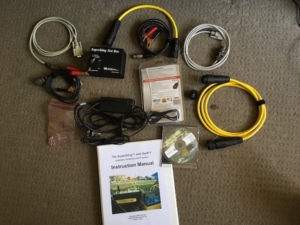
This system package includes:
-
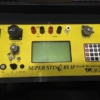
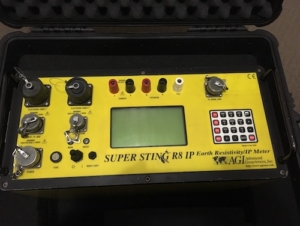
SuperSting™ R8 Wi-Fi with Tablet Controller – Qty 1
-
Cable of 14 electrodes (6.25m electrode spacing OR 10.25m electrode spacing) – Qty 4 (making a total of 56 electrodes)
-
SwitchBox Grid – Qty 1
-
Key to use EarthImager™ Software (Your choice of 2D or 3D) – Qty 1
-
Free admission for one person: 3-day training seminar (airfare & lodging not included) – Qty 1
Use Cases:
We’ve designed this 56-electrode system package to handle various jobs. Below are just a few use cases that this package would be ideal for:
-
Mineral Exploration
-
Metallic mineral investigations
-
Non-Metallic mineral and aggregate mining investigations
-
-
Geotechnical and Civil Engineering Investigations
-
Locating tunnels, caves, sinkholes, and fault- fractures
-
Dam and levee investigations
-
-
Groundwater Exploration
-
Irrigation
-
Drinking water
-
Saline/freshwater interface mapping along coastlines and petroleum drilled areas
-
-
Environmental and Monitoring Investigations
-
NAPL (DNAPL and LNAPL) pollution research for remediation of hydrocarbons
-
CO2 Sequestration Time-Lapse Monitoring
-
ASTM D7007: Geomembrane Leak Detection
-
-
Bedrock and Landfill Mapping
-
Grounding Surveys for Power Plants and Cell Phone Towers
-
Archeological Investigation
-
Borehole Logging
-
Short-Long-Leterolog-SP
-
Cross-borehole tomography
-
-
IEEE Standard 81: Fall of Potential (FOP) Method
-
ASTM G57: Wenner Soil Resistivity Test
-
Underwater and Marine Studies
-
Determining sub-bottom geology for dredging purposes
-
Monitoring leakage in a dam
-
Mapping fresh and saltwater interfaces near shorelines or offshore
-
Characterizing the sub-bottom of estuaries
-
Measuring water column salinity variations
-
Mineral exploration (usually placer deposits)
-
Locating freshwater springs at sea (submarine groundwater discharge)
-
Distinguishing between hard rock, sand, gravel, silt, and clay
-
Gas Hydrate Exploration
-
Subsurface geotechnical site investigation for oil platforms
-
Sediment research
-
Fracture Imaging
-
Resistivity and IP studies for deep mining, oil/gas investigations
-
AGI EarthImager™ 2D
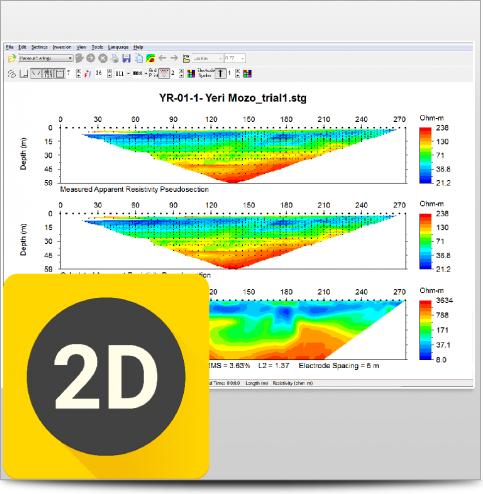
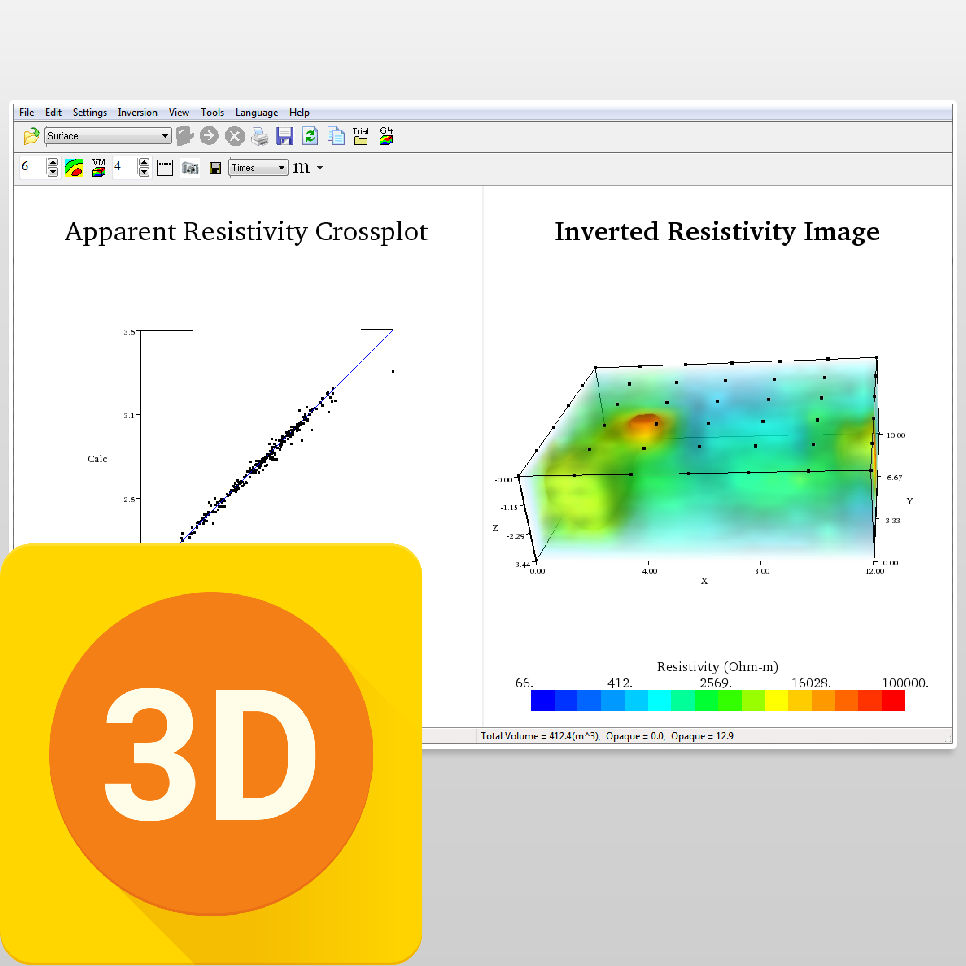
AGI EarthImager™ 2D is a two-dimensional inversion modeling software for affordable resistivity and induced polarization (IP) imaging. It interprets data collected by the SuperSting™ Wi-Fi in just a few clicks, including parallel boreholes or on a surface line.
The data set, collected using SuperSting™ Wi-Fi earth resistivity imaging instruments, is processed into a 2D cross-section of the earth. The processed data can be output to various types of files and can be processed into reports ready for submission to the client.
Any array or mixed data from Schlumberger, Pole-Pole, Pole-Dipole, Dipole-Dipole, or Wenner electrode arrays are possible to invert. A special “Survey Planner” allows the user to enter a geological model and run a virtual survey and then invert the virtual data to see if the objective of the survey can be met.
Watch how easy it is to process ERI data using AGI EarthImager™ 2D:
Use Cases:
EarthImager™ 2D is for use in geotechnical and geologic industries, including the following applications:
-
Cave and void detection
-
Depth-to-bedrock mapping
-
Ground water exploration
-
Mineral exploration
-
Mapping environmental spills
-
Monitoring environmental cleanup progress
-
Aggregate mapping
Determining the best location for a well in a rural, underdeveloped area—so the individuals in the surrounding area have access to safe and clean drinking water—is an excellent use of the EarthImager™ 2D. Drilling is expensive and drill maintenance is even more so, so if an non-governmental organization (NGO) decides to drill a new well, they need to know with certainty where to place it. By using EarthImager™ 2D, the ground water exploration team can create a tomogram that shows where the best location for a producing well is.
Features:
-
User-friendly Windows GUI.
-
Seamless operation with AGI resistivity instruments.
-
Survey planner with graphical model input, virtual survey with the actual command file, and inverse simulation with user-specified Gaussian noises.
-
Topographic correction and printout of resistivity section with topographical features.
-
Data editing for detecting and removing erroneous data points and bad electrodes.
-
No software limit on number of data or number of electrodes.
-
No limit on electrode array type or electrode location.
-
Inversion progress bar to show the inversion status.
-
Data misfit scatter plot and cross-plot.
-
Reversal and horizontal shift of a profile.
-
High-definition report quality plat-style printout.
-
Batch inversion of many data files.
-
Borehole command creator for AGI SuperSting™ instruments.
-
Support of other instrument brands’ data file format.
Methods & algorithms
-
Finite difference and finite element forward modeling.
-
Options of boundary condition for forward modeling.
-
Three inversion algorithms: damped least squares, smooth model, and robust inversion.
-
IP data processing by linear inversion.
-
Uses Gauss-Newton and quasi-Newton methods.
-
Both root-mean-squared (RMS) error and L2-norm statistics to monitor the inversion progress and convergence.
-
Windows TrueType font and true 24-bit color.
Miscellaneous
-
Fast graphics with automatic refresh and scalable image.
-
Real-time scrolling through all iterations using the mouse wheel, creating “movie-like” animation.
-
Noisy data suppression.
-
A graphical a-priori information input interface.
-
Removable contour curves and automatic blanking.
-
Windows TrueType font and true 24-bit color.
-
Trackable and retrievable user settings.
-
Tool buttons and pop-up menus for easy access to frequently used menu items.
-
Well-organized and hassle-free processing directory structure.
-
Automatic file-saving feature with on/off options.
-
Retrievable inversion output/log file.
-
Saveable as bitmap, JPEG, or Windows metafile files at three resolution levels.
-
Saveable in XYZ format so it can be loaded into any off-shelf graphics software.
-
Check of computer memory status to estimate processing capability.
-
Convergence curve display.
